
A bin can look fine outside while a warm pocket quietly damages grain quality. This grain storage temperature chart safe ranges guide gives farmers practical starting points for corn, soybeans, wheat, and barley, then connects each number to moisture, airflow, season, and storage time.
Contact Farm Shop MFG about your grain bin monitoring setup.
For most stored grain, start by keeping the grain below 50 degrees F. For long-term winter storage, a common working target is 30 degrees F to 40 degrees F when outside conditions allow, but that range is not a guarantee. Crop, moisture, fines, airflow, storage duration, and the direction of the temperature trend determine what you do next. A localized or rising reading near 60 degrees F is a reason to investigate the warmest zone, moisture, and trend, not a universal spoilage threshold. Use the table below for practical starting points for corn, soybeans, wheat, and barley.
What Grain Storage Temperature Should You Target by Crop?
A useful grain storage temperature chart pairs a cooling target with crop and storage conditions. Start below 50 degrees F, use 30 degrees F to 40 degrees F as a common winter target when conditions permit, and treat both as working guidance rather than a guarantee. If a localized or rising reading approaches 60 degrees F, investigate it before deciding on aeration, sampling, or grain movement.
| Grain | Cool target | Moisture context | Watch for |
|---|---|---|---|
| Corn | Below 50 degrees F; near 40 degrees F for winter storage when suitable. | Often about 13% to 14%, adjusted for the storage plan. | Warm center, top-center moisture movement, and wet pockets. |
| Soybeans | Below 50 degrees F as a risk-control starting point. | Often about 11% to 12%, adjusted for condition and duration. | Temperature gradients, fines, and damaged beans. |
| Wheat | Generally below 50 degrees F when practical. | Often about 13%, adjusted for class and storage plan. | Fines, dockage, restricted airflow, and uneven filling. |
| Barley and small grains | Below 50 degrees F as a starting point. | Barley is often planned near 12%, subject to crop guidance. | Moisture pockets, crusting, and crop-specific risks. |
These are reference points, not a guarantee that grain is safe. Confirm final moisture targets with current guidance and your grain buyer. North Dakota State University Extension resources provide crop-specific storage information. For a time-based view between inspections, review Farm Shop MFG’s grain temperature and humidity monitoring system. A reading near or above 60 degrees F deserves investigation, especially when one probe is climbing or moisture is elevated.
What Temperature Is Too High for Corn Storage?
There is no universal spoilage cutoff for corn, but a reading near or above 60 degrees F is a practical warning point. Investigate the warmest zone, moisture, and trend before running fans. A steady rise, isolated hot spot, odor, crusting, or condensation matters more than a comfortable bin average.
Corn can develop a warm center, top-center moisture migration, or a pocket near fines. A roof or south wall may heat faster than the grain mass. The trend often matters more than a single reading. A probe that rises steadily while nearby probes remain stable deserves attention even when the average looks acceptable.
When a reading changes, record the date, outside weather, warmest probe, average temperature, and latest representative moisture result. Check accessible areas for crusting, caking, odor, insects, or condensation. If a hot spot persists or spreads, sample the affected area and decide whether targeted aeration or grain movement is appropriate. See Farm Shop MFG’s guide to what causes hot spots in grain bins for additional warning patterns.
How Can a Grain Storage Temperature Chart Safe Ranges Guide Improve Checks?
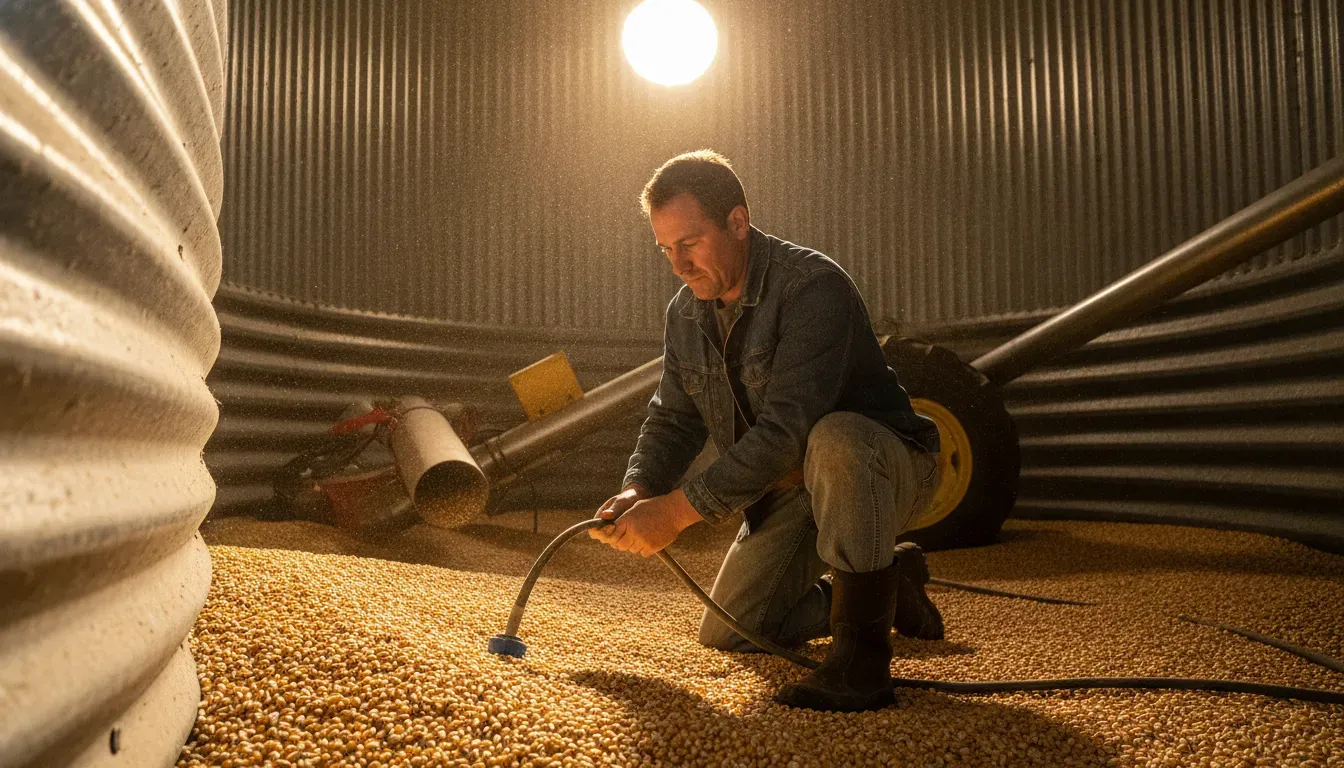
A grain storage temperature chart safe ranges guide becomes useful when each reading is paired with a date, probe location, moisture result, and weather note. Compare the warmest zone with its previous reading. A rising pocket or returning hot spot needs investigation, even when the bin average remains below 50 degrees F.
Walking a bin gives you a physical check at one moment. A monitoring routine adds a time-based view. Use the same probe locations and record the warmest point, average temperature, and direction of change after major weather shifts and aeration cycles.
Do not treat a chart as a pass-or-fail test. A cool reading can still need attention if fines restrict airflow or a sample is not representative. A warmer reading may reflect a temporary pattern, but it still needs context. Review the grain condition, storage duration, moisture, and equipment before choosing an action.
Why the bin average can hide a problem
The average temperature can look acceptable while one section is warming. That is why the warmest probe deserves its own place in the record. Compare it with nearby probes and with the same probe from the previous check.
Temperature differences also reveal where to inspect. A warm center can point to fines or moisture movement. A warmer roof or south wall can reflect solar heating. A change near an inlet or outlet can point to airflow conditions. These patterns are clues, not diagnoses.
Use the chart with a consistent record for each bin. Note the crop, fill date, moisture result, probe locations, warmest temperature, bin average, outside conditions, and action taken. A simple record makes it easier to spot a trend during a busy harvest season.
Match the response to the condition
A stable bin within the working range may only need routine monitoring. A rising probe calls for a closer inspection and a fresh sample. A hot spot, unusual odor, crusting, or condensation needs a more direct response plan. Do not wait for the average to rise before investigating a clear localized change.
Safety comes before a temperature target. Bridging grain, crusted surfaces, moving augers, and confined spaces create hazards that a chart cannot solve. Keep people out of unsafe areas and follow the farm’s grain-handling procedures before opening, entering, or moving grain.
After an aeration cycle, wait for the cooling front to pass through the grain mass before judging the result. Check the same probe locations again. If the warm spot returns, review moisture, fines, airflow, and the possibility that the fan did not reach the affected zone.
How Do Soybean Storage Temperatures Change the Risk?
Soybeans need temperature and moisture context together. Use below 50 degrees F as a practical risk-control starting point, then account for moisture, fines, damage, storage length, and differences between zones. Compare the warmest probe with its trend instead of relying only on the bin average.
A practical summer moisture reference for soybeans is about 11% to 12%, but the correct decision depends on condition and duration. Damaged beans and fines can reduce airflow. A cold sample can also produce a misleading moisture result if it is tested before reaching room temperature.
When a sample is below 40 degrees F, place it in a sealed bag and let it warm to room temperature before testing. The container limits moisture exchange with surrounding air. Test another representative sample if the result changes after warming. For fan decisions, review University of Minnesota Extension aeration guidance and match the plan to current outside conditions.
What Ranges Apply to Wheat and Small Grains?
Wheat and small grains are generally easier to protect below 50 degrees F when practical. A working moisture reference is about 13% for wheat and about 12% for barley, but crop class, fines, airflow, and storage length can change the target. Keep a separate plan for each bin and crop.
Small grains can look stable while a concentrated fines layer restricts airflow. Check the peak and areas where grain entered unevenly. A warmer pocket, crusted surface, unusual odor, or persistent difference between sensors warrants closer inspection even when the average is below the chart target.
Do not apply a corn target automatically to wheat or barley. Keep the crop, moisture result, temperature trend, and storage duration together in the bin record. If conditions change, compare the new reading with the previous reading rather than treating the chart as a one-time pass or fail.
Separate the crop plan from the equipment plan
The crop target and the monitoring setup answer different questions. The target helps you judge the condition of the grain. The monitoring setup helps you see where the condition is changing. Keep both in the same bin record so an alert leads to a useful inspection instead of a guess.
For wheat and barley, pay close attention to fines and uneven filling. Restricted airflow can make one area behave differently from the rest of the bin. Record where fines collect and compare that location with the warmest probe. A repeatable location is useful evidence when you decide whether to clean, level, aerate, or move grain.
For corn and soybeans, connect the temperature trend to the moisture result and planned storage length. Grain that will be held into warmer weather needs a different review schedule than grain scheduled for an early delivery. The chart is most helpful when it supports that decision before a warm pocket becomes a broader quality problem.
How Should You Use the Chart Before Running Fans?
Before running a fan, compare the chart with representative moisture, outside air, airflow, and the temperature pattern inside the bin. Use cool, dry conditions when appropriate, move a controlled cooling front through the grain, and recheck afterward. Do not treat fan inlet air as proof that the grain mass is cool. For farms evaluating automated fan control, review Farm Shop MFG’s EndZone automated fan controller as an equipment option.
- Identify the crop and moisture. Record the latest representative moisture result, storage length, fines, and known damage.
- Compare the warmest reading with the target. Record both the average and warmest probe. An isolated or rising reading deserves attention.
- Inspect likely hot spots safely. Check the center, top-center, roof vents, south wall, and fines layers for condensation, crusting, odor, insects, or restricted airflow.
- Choose suitable outside air. Use cool, dry conditions and a properly sized fan. Level grain so airflow reaches the mass evenly.
- Watch the cooling front. Allow the temperature change to move through the grain, then confirm the result with probe readings.
- Stop and recheck. Excessive aeration can overdry grain. Retest moisture when appropriate and investigate any hot spot that returns.
How Does Grain Bin Temperature Monitoring Improve the Routine?
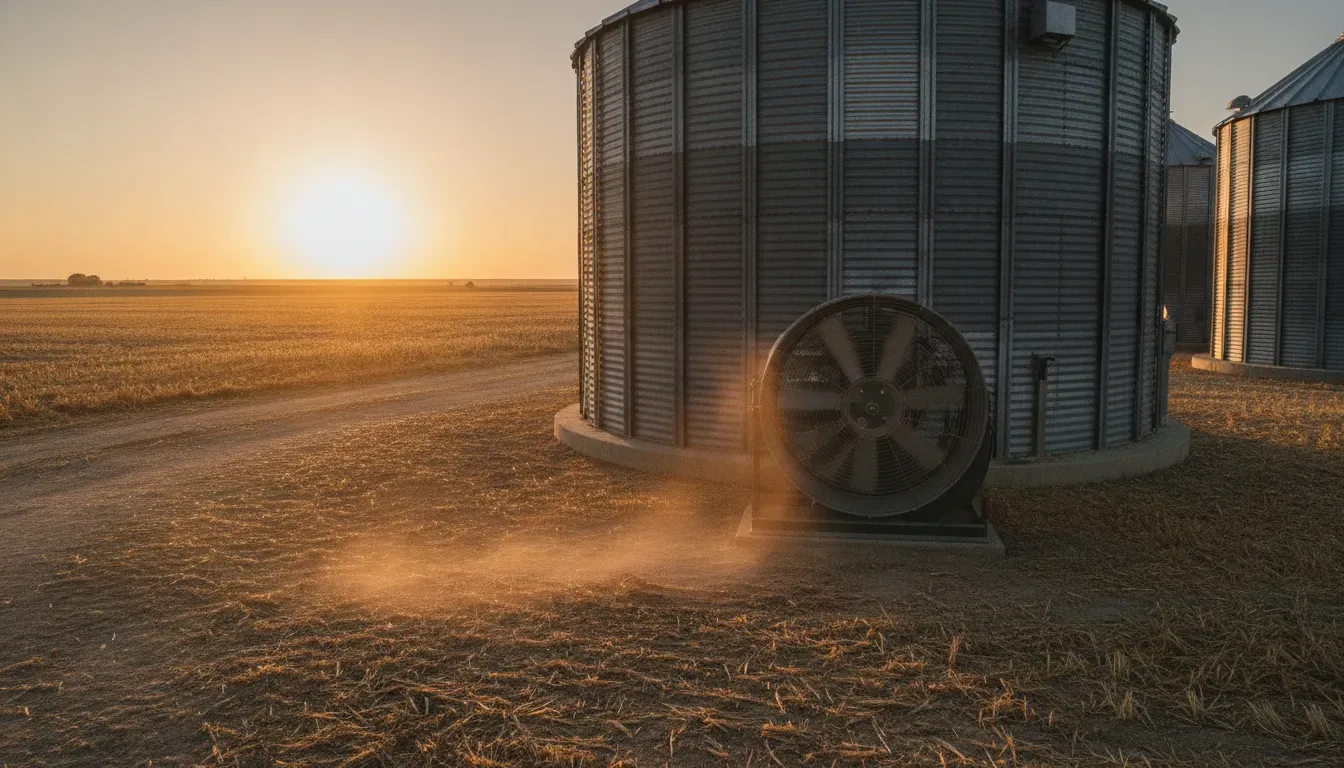
Monitoring adds a time-based view to physical inspections. Comparing the same probe zones over time can reveal a rising pocket, a repeating seasonal pattern, or a reading that differs from nearby points. That evidence helps direct inspection and aeration decisions before a localized problem affects more grain.
Grain Temp Guard is Farm Shop MFG’s grain temperature and humidity monitoring system. It offers Dual-Temp and Humidity-Temp configurations, visual and audio alarms, and multiple probe length options. Read how a grain bin monitoring system works and review the Grain Temp Guard product information.
Monitoring does not replace sampling, fan and vent maintenance, physical inspection, or a safe work plan. Use the reading to prioritize the next check. Keep records simple: date, probe location, temperature, moisture result, weather note, and action taken.
The grain bin temperature monitoring guide explains how this routine fits into broader harvest protection. Use the chart to start the conversation, then build a repeatable process for every bin.
Contact Farm Shop MFG to discuss your grain monitoring setup.
Frequently Asked Questions
What is the safe temperature range for grain storage?
Grain is generally easier to protect below 50 degrees F. Long-term winter storage commonly targets about 30 degrees F to 40 degrees F when conditions allow. The right range depends on crop, moisture, season, airflow, and storage length.
At what temperature does grain spoil?
There is no single cutoff for every load. A reading near or above 60 degrees F, a rising probe, or a persistent difference between zones should trigger investigation, sampling, and a review of the aeration plan.
How often should stored grain be checked?
Check stored grain at least every two weeks during active spring and summer management. Check more often when readings change, moisture is marginal, or weather creates large temperature swings. Record dates and trends.
Can a grain monitor replace physical inspection?
No. A monitor shows temperature and humidity trends between inspections, but farmers still need to sample grain, maintain fans and vents, and respond safely to changing conditions. The data directs attention; it does not replace judgment.